Our Model Portfolios
How do you choose how much you want to invest in equity or fixed income? These allocation models can help you understand different goals-based investment strategies. We use mutual funds and ETF’s to structure each model so that you are diversified into the categories that consistently perform well in the long term. There's no right or wrong model, so it's important to tune in to what you feel best fits your goals and risk tolerance.
All average annual returns seen below are net of advisory fees.
Growth
A growth portfolio consists of equity investments expected to appreciate, taking into account long-term potential and potentially large short-term price fluctuations. An investor seeking this portfolio has a high risk tolerance and a long-term investment time horizon. Generating current income isn’t a primary goal.
100% equity / 0% Fixed Income
Historical Return for January 2016 - January 2026
Average annual return: 16.83%
Description: This portfolio is entirely invested in the stock market. It is designed for the most aggressive investors who are seeking maximum growth potential and are comfortable with high volatility and risk. The primary objective is capital appreciation.
Best Year: 34.54 (2023)
Worst Year: -23.06 (2022)


80% equity / 20% Fixed Income
Historical Return for January 2016 - January 2026
Average annual return: 13.09%
Description: This portfolio allocates 80% to equity and 20% to fixed income, balancing growth and risk more than the 90/10 portfolio. It is suitable for investors who want significant growth but are also looking for some stability and income through fixed income investments.

70% equity / 30% Fixed Income
Historical Return for January 2016 - January 2026
Average annual return: 11.64%
Description: With a 70% allocation to equity and 30% to fixed income, this portfolio is considered moderately aggressive. It aims for growth while providing a larger cushion of fixed income for more stability and regular income.
Balanced
A balanced portfolio invests in both equity and fixed income to reduce potential volatility. An investor seeking a balanced portfolio is comfortable tolerating short-term price fluctuations, is willing to tolerate moderate growth, and has a mid- to long-range investment time horizon.

60% equity / 40% Fixed Income
Historical Return for January 2016 - January 2026
Average annual return: 10.17%
Description: This balanced portfolio splits investments into 60% equity and 40% fixed income. It is appropriate for investors who seek a mix of growth and income with moderate risk. This portfolio aims to provide both capital appreciation and some degree of stability and income.

50% equity / 50% Fixed Income
Historical Return for January 2016 - January 2026
Average annual return: 8.69%
Description: Equally divided between equity and fixed income, this portfolio is suitable for moderate investors who desire a balance between growth and stability. It offers a good mix of capital appreciation and income, with moderate risk and volatility.

40% equity / 60% Fixed Income
Historical Return for January 2016 - January 2026
Average annual return: 7.2%
Description: With 40% in equity and 60% in fixed income, this portfolio leans towards conservative investment. It is designed for investors prioritizing income and stability over growth, but still seeking some potential for capital appreciation.
Income
An income portfolio consists primarily of dividend-paying equity and prime money market mutual funds. If you're comfortable with minimal risk and have a short to midrange investment time horizon, this approach may suit your needs. Keep in mind, depending on the account, dividends and returns can be taxable.

30% equity / 70% Fixed Income
Historical Return for January 2016 - January 2026
Average annual return: 6.49%
Description: This portfolio allocates 30% to equity and 70% to fixed income, focusing on income generation and capital preservation. It is appropriate for conservative investors who want a higher degree of stability and are less concerned with growth.
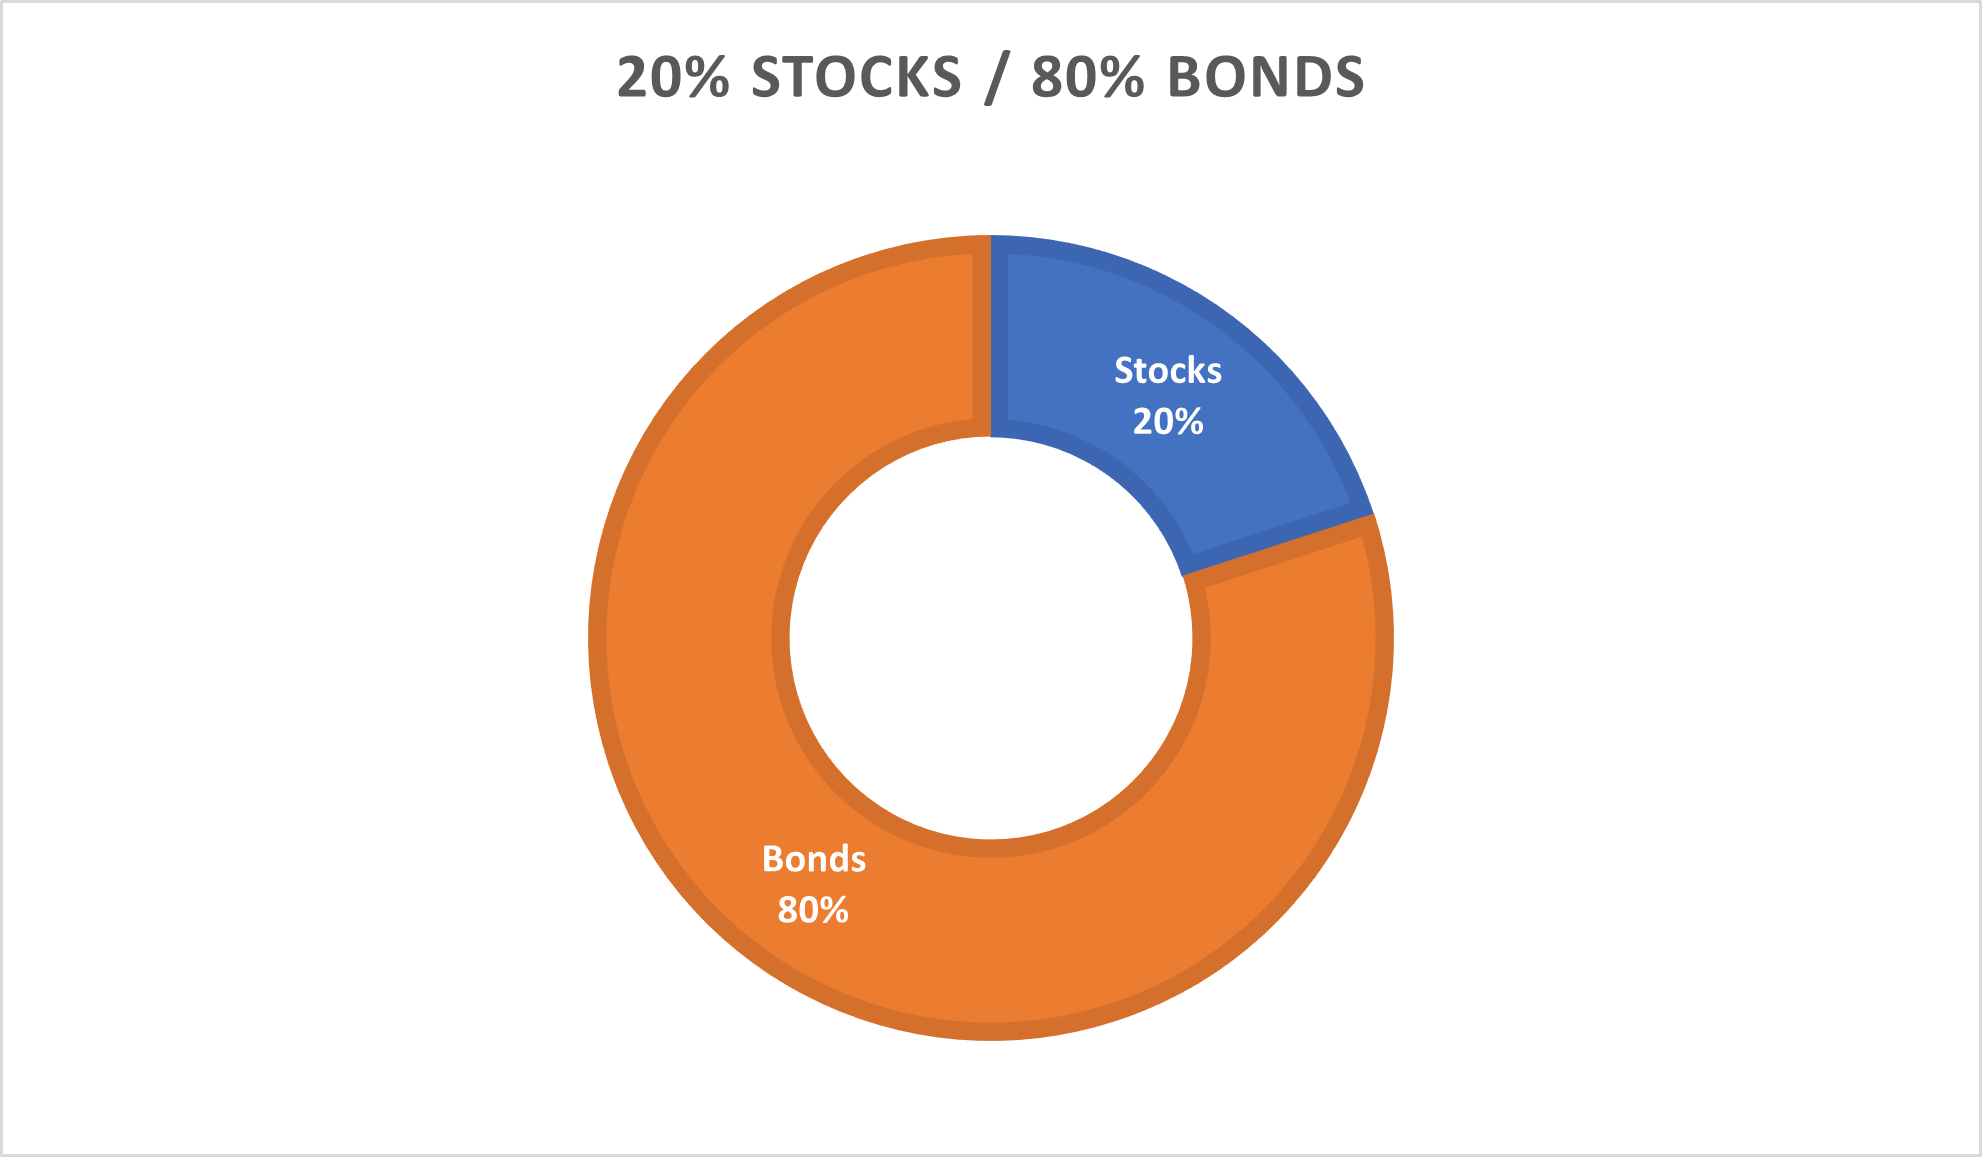
20% equity / 80% Fixed Income
Historical Return for January 2016 - January 2026
Average annual return: 4.18%
Description: With only 20% in equity and 80% in fixed income, this portfolio is very conservative. It aims to provide a steady income stream and preserve capital, suitable for investors with a low risk tolerance.

100% Fixed Income
Historical Return for January 2016 - January 2026
Average annual return: 1.88%
Description: Entirely invested in fixed income, this portfolio is ideal for the most conservative investors. It aims to provide a reliable income stream and preserve capital, with no exposure to stock market risk.
Dave Ramsey Model
This model combines Dave’s principles with our research on high quality, long-term investments. Its allocation is made up of the mutual funds from the four categories you have heard him speak about on his show. It is designed for investors with a high risk tolerance and long-term time horizon.

100% equity
Historical Return for January 2015 - January 2025
Average annual return: 14.77%
Best year: 28.92% (2019)
Worst year: -18.45% (2022)
This information should not be relied upon for tax purposes and is based upon sources believed to be reliable. No guarantee is made to the completeness or accuracy of this information. Tucker Financial Group shall not be responsible for any trading decisions, damages, or other losses resulting from, or related to, the information, data, analyses or opinions contained herein or their use, which do not constitute investment advice, are provided as of the date written, are provided solely for informational purposes, and therefore are not an offer to buy or sell a security. This information has not been tailored to suit any individual.
Tucker Financial Group does not guarantee the results of its advice or recommendations, or that the objectives of a strategy will be achieved. Portfolios offered by Tucker Financial Group may not have contained and/or may not currently contain the same underlying holdings and may have been and/or may currently be managed according to rules or restrictions established by Tucker Financial Group. No graph, chart, or formula in this presentation can be used in and of itself to determine which securities to buy or sell, when to buy or sell securities, whether to invest using this investment strategy, or whether to engage Tucker Financial Group’s investment advisory services. Ramsey Solutions and Tucker Financial Group are not affiliated.